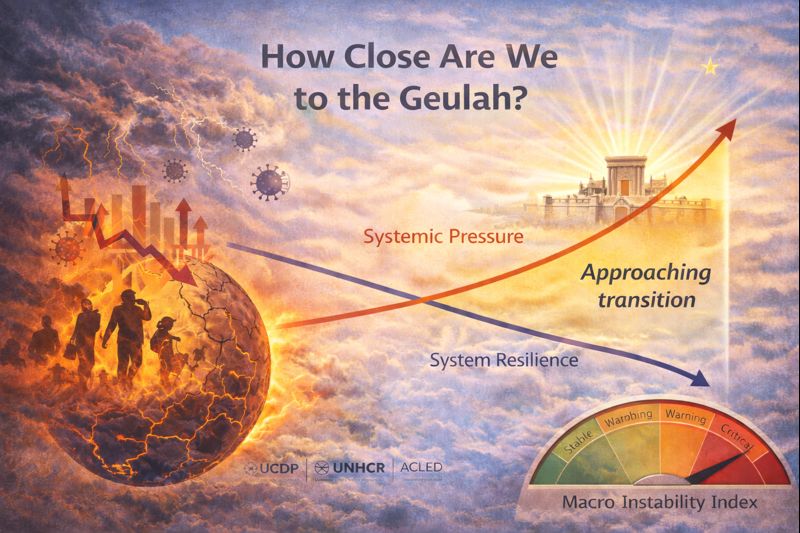
The Macro Instability Index and early warning signs of an approaching transition
Synopsis
This essay is the fourth installment in the series on dreams and phase transitions. It turns the metaphor operational. Having established that instability is the main symptom of impending second-order phase transition, the essay introduces the Macro Instability Index (MII) as a “pressure gauge” that aggregates major drivers of systemic stress—conflict, displacement, unrest, outbreak burden, and antisemitism—and pairs it with early warning signs (EWS) as a “resilience gauge”: signals such as slowing recovery that often precede regime shifts. The goal is to forecast probabilities rather than dates: to distinguish a system that is merely strained from one that is both highly loaded and losing the capacity to return to baseline. Our predictive model shows that we are at the critical level of social instability—the highest since the input parameters have been systematically tracked. That indicates that we are on the verge of a major phase transition—”redemption in its time” (geulah b’itah). In the final installment, we will translate diagnosis into action: how individuals and communities can hasten the “accelerated redemptions” (“geulah aḥishenah”).
Introduction
In my recent essay “G‑d Who Dreams: Creation, Companionship, and the Entropic Imagination,”[1] I explored the classical metaphor of creation as a divine dream. In the next essay, “Phase Transitions I: Sleep Architecture of Joseph’s Dreams,”[2] I proposed a correspondence between the architecture of sleep and Joseph’s life. In the last essay, “Phase Transitions in Human History,”[3] I showed how Jewish history can be viewed as a series of phase transitions. Here, we examine the signs of the imminently approaching redemption.
As I wrote in the previous essay in this series, classical Jewish sources, including the Talmud, Midrash, biblical commentators, Kabbalah, and Ḥasidut, all portray Exile (Galut) as a dream.[4] The messianic redemption that will take us out of the Exile can come in two ways.
The prophet says:
I, the Lord, in its time I will hasten it.” (Isaiah 60:22)
Talmudic Sages read this as two possible timelines for the arrival of redemption. The Talmud (tr. Sanhedrin) resolves the tension: if we merit, redemption comes suddenly—aḥishenah (“I will hasten it”); if we do not merit, it arrives at the destined time—be’itah (“in its time”).[5]
In this installment, we ask the question this series has been building toward—how close are we to the ultimate redemption? In the previous essay, I proposed that these two possible types of redemption, geulah aḥishenah and geulah be’itah, correspond to the two types of phase transitions in systems dynamics—first-order and second-order transitions. In physics, a first-order phase transition is discontinuous (like ice melting to water). In contrast, a second-order transition is continuous but marked by diverging fluctuations (like iron acquiring magnetic properties below the Curie point). I suggest that geulah aḥishenah resembles the former; geulah be’itah resembles the latter. Figure 1 illustrates these two paths. As discussed there, the main symptom of the approaching second-order transition is increasing instability in the system.[6] If so, as we approach geulah b’itah, we should expect a significant increase in instability.
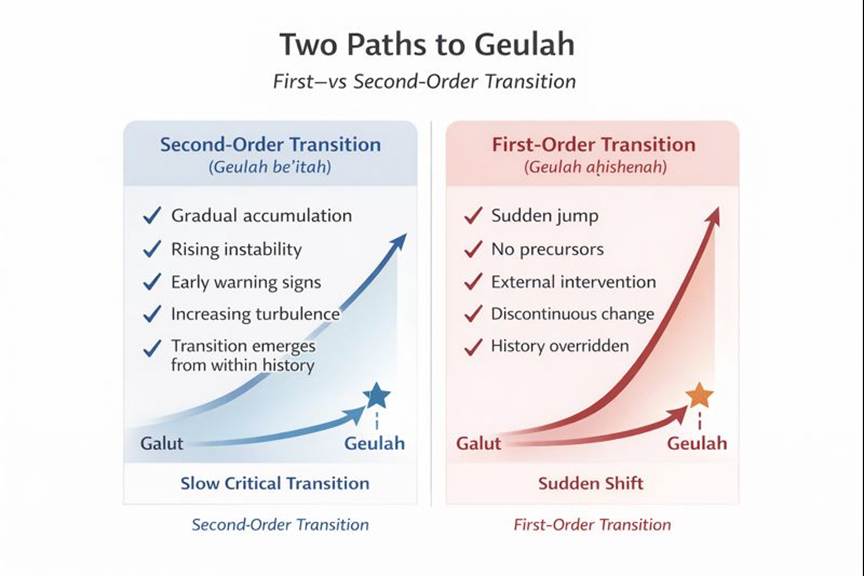
Figure 1. Two Paths to Geulah, by GPT 5.2
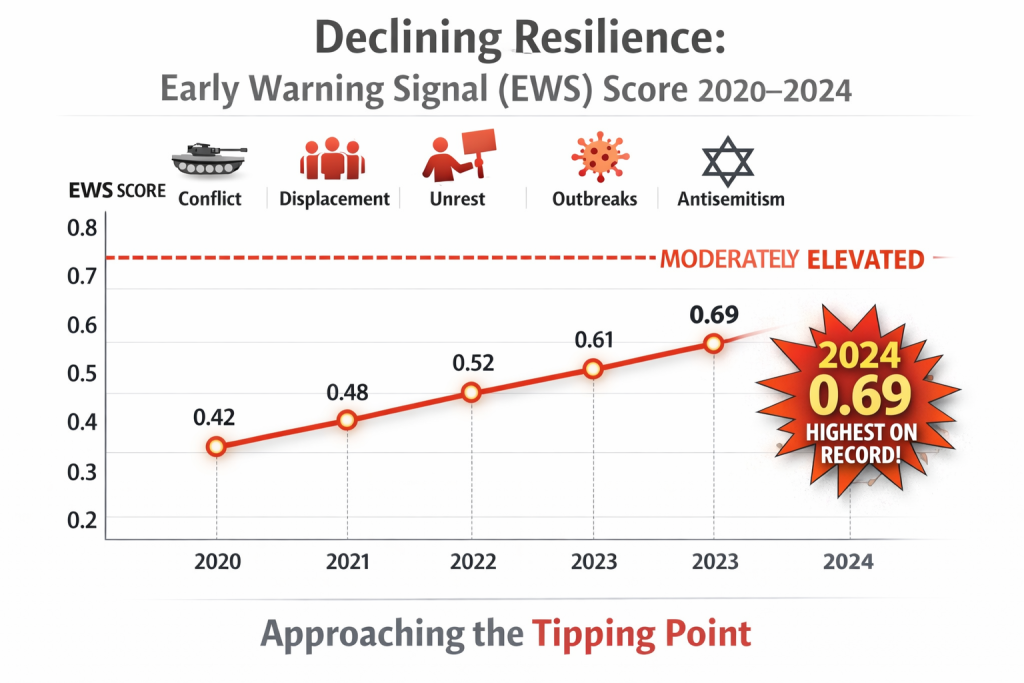
To estimate the level of instability (as a proxy measure of the closeness of the second-order phase transition), we will develop the Macro Instability Index (MII) as a “pressure gauge” that aggregates major drivers of systemic stress—conflict, displacement, unrest, outbreak burden, and antisemitism. The predictive model we built pairs MII with early warning signs (EWS) as a “resilience gauge”: signals such as rising autocorrelation, rising variance, and slowing recovery that often precede regime shifts. Figure 2 illustrates these patterns. We will develop a predictive mathematical model that can periodically assess the instability level (a primary indicator of the approaching transition) and the early warning signs. The objective is not to predict exact dates, but to assess the symptoms and the early warning signs of the impending phase transition from the exile into the ultimate phase—the redemption (geulah be’itah). As we will see, the model indicates unprecedented levels of instability.
1. Instability at a Critical Point
Psalms describe redemption in dream-language:
When G-d restored the fortunes of Zion, we were like those who dream.” (Psalms 126:1)
The verse is not merely poetic; it captures an experience familiar to anyone who has lived through upheaval: when the world finally stabilizes, the prior period feels unreal, like a fevered night—how did we accept that as normal?
Exile often feels like that: a condition in which moral and social logic become dreamlike. Boundaries blur. Contradictions coexist. The same patterns repeat with minor changes. Events feel both shocking and inevitable. This is precisely what Joseph highlights in Pharaoh’s double dream: repetition is the sign that the underlying structure has shifted, and the future is near.
Pharaoh saw two dreams, which Joseph recognized as structurally equivalent and carrying the same message. A stable system does not need to repeat itself. It can whisper once, and the world stays put. However, as a system approaches a tipping point, signals echo. They return in different costumes. They insist. They become hard to ignore.
In physics, we see this as a material nears a phase change: ice melts discontinuously (a first-order transition), but near certain critical points—such as the liquid-gas critical point—fluctuations intensify gradually (a second-order transition). Liquid water quietly absorbs energy until it abruptly becomes vapor, and near certain critical points, fluctuations intensify and spread. In human societies, the analog is not molecular but social: tension accumulates, “noise” grows, contradictions sharpen, scapegoats are nominated, and then a new social phase arrives—sometimes gradually signaling the second-order transition (relevant to the geulah be’itah), sometimes all at once, signaling the first-order transition (geulah aḥishenah).
If the Exile is a dream, it becomes natural to ask a Joseph-like question about our own era: What would it mean to interpret the “dream” of the present? Not in the sense of predicting dates, but in the sense of measuring instability—tracking the social equivalents of stress fractures and repeated omens.
If the geulah aḥishenah is anything like a first-order phase transition, as I suggested in the previous essay,[7] it will be heralded by increased instability and release of the “latent heat”—violence, unrest, and natural disasters. To measure the degree of instability, we developed the Instability Index. The formula includes weighted contributions of five factors: war & conflict spread, forced displacement / humanitarian stress, social upheaval (protests/riots), epidemic/outbreak breadth, and antisemitism severity, detailed in the Addendum I. (Note that in the second-order transition, there is no release of the latent heat. Instead, there is a divergence of fluctuations and susceptibility, which is relevant to the geulah b’itah.)
If we take Joseph’s story seriously, we should look for two things: repeated signals (the dream doubling), and established trendlines pointing to an imminent transition.
At the global level, at least two post–WWII indicators are at record highs in the most recently audited year, 2024, as detailed in Addendum I.
I included antisemitism as one of the contributing factors in my Instability Index because antisemitism is not merely one hatred among others. Historically, it has behaved like a toxin that rises when societies become unstable: as economic strain, war, epidemic fear, and political fragmentation intensify, the temptation to locate a single “hidden hand” behind complexity grows stronger. Jews become a convenient symbolic target—the scapegoat—precisely because antisemitism offers an all-purpose conspiracy template. That does not mean every crisis produces antisemitism, or that antisemitism has only one source. It does mean that when antisemitism rises across multiple countries and sectors, it is rarely a local anomaly. It is often a sign that deeper societal narratives are degrading—that the social immune system is failing. To use an old cliché, Jews are canaries in a coal mine. Rising antisemitism across the board is a symptom of serious societal decay—the underlying structure is crumbling.
In the post–October 7 world, multiple monitoring organizations report unusually elevated levels of antisemitic incidents across several major Jewish communities, with variations by country (year 2024):
| Country | Source | A number of Antisemitic incidents | Increase |
| US | Anti-Defamation League (ADL) | 9,354 | 344% increase over the past five years and a 893% increase over the past 10 years. |
| UK | Community Security Trust (CST) | 3,528 | The second-highest annual total |
| Germany | Federal Research and Information Point for Antisemitism (RIAS) | 8,627 | Near double the prior year’s figure |
| France | Service de Protection de la Communauté Juive (SPCJ/CRIF) | 1,570 | One of the highest |
| Australia | Executive Council of Australian Jewry (ECAJ) | 2,062 | 316% |
Using the latest published annual data (mostly through 2024, with a few 2025 snapshots where available), the MII lands near the top of its post-WWII scale in this template (approximately 97 out of 100). (For a mathematical description of the model, see Addendum I.) In Joseph’s language: the dream is repeating, and “the matter is imminent”—not as a timetable, but as a description of a system pushed to a threshold.
None of this “proves” what exactly happens next, or exactly when it will happen. My model predicts an unprecedented level of instability. From the perspective of systems dynamics (particularly the nonlinear dynamics of phase transitions), we are on the verge of a major phase transition. My interpretation of this phase transition as the transition from Exile to Redemption derives from the words of the Lubavitcher Rebbe, Rabbi Menachem Mendel Schneerson, who, in 1991, quoted the Midrash[8]: “The time of your redemption has arrived!”[9]
Joseph did not claim to know every detail; he identified the structure and proposed a plan. The Torah invites us to do likewise: measure instability so we can respond with a plan.
2. Early Warning Signs of an Approaching Phase Transition
The Macro Instability Index (MII) tells us how “loaded” the system is: more conflict, more displacement, more unrest, more outbreak pressure, more hate—especially antisemitism—push the social landscape toward the edge of stability. However, there is a second question, equally important to the level of pressure: How resilient is the system currently?
In the language of phase transitions, a system can look calm even as it loses its ability to recover. It can keep its familiar shape—until it suddenly cannot.
This is exactly what Joseph teaches Pharaoh in narrative form. The dream recurs because the system is no longer merely strained—it is close to a phase transition. Repetition is the Torah’s way of saying the future has begun to press on the present.
The Macro Instability Index (MII) is our “pressure gauge.” Early warning signs (EWS) are our “resilience gauge.”
2.1 What the Early Warning Signs Show
In the study of complex systems, this pattern is known as critical slowing down: as a system approaches a tipping point, it recovers more slowly from disturbances. Shocks fade less quickly, fluctuations grow larger, and the system begins to “stick” near unstable states.
When we examine how the system responds to repeated shocks over time, we see three converging signs of declining resilience. First, disturbances now linger much longer than they used to: each year increasingly resembles the last, rather than returning to a stable baseline (technically, rising autocorrelation). Second, fluctuations have become unusually large, indicating that the system is oscillating rather than settling (i.e., the variance is increasing). Third, recovery from shocks has slowed to the point that the system sometimes fails to return to its prior state at all (technically, AR(1)). Taken together, these signals indicate that the system is losing its capacity to absorb stress without undergoing structural changes.
(The statistical details and definitions of these indicators are given in Addendum II.)
2.2 What critical slowing down looks like in real life
In a resilient society, shocks are absorbed and fade. In a less resilient society, shocks linger, echo, and compound. You do not merely observe more crises—you observe a slower return to baseline after each one.
This “slowdown” has recognizable fingerprints in the public record:
- Memory increases. Yesterday’s disturbance looks more like today’s reality. Narratives persist; polarization hardens; corrective swings weaken.
- Volatility rises. Instead of dampening, swings amplify. Headlines do not settle; the system overshoots and oscillates.
- The tempo slows. Long-wave cycles dominate: protracted conflicts, sustained disinformation, chronic institutional distrust, lingering trauma effects.
- Flickering appears. The system alternates (like a light switch stuttering before failing) between two incompatible regimes—order and disorder, moderation and extremity—before one “wins.”
- Synchronization increases. Separate domains start moving together: economics (uncorrelated markets move in the same direction), geopolitics, public health, domestic polarization, and scapegoating converge into a single coupled crisis.
These are not mystical signs. They are what you would expect when the social “potential landscape” flattens—when the old equilibrium is still present, but it no longer has deep walls.
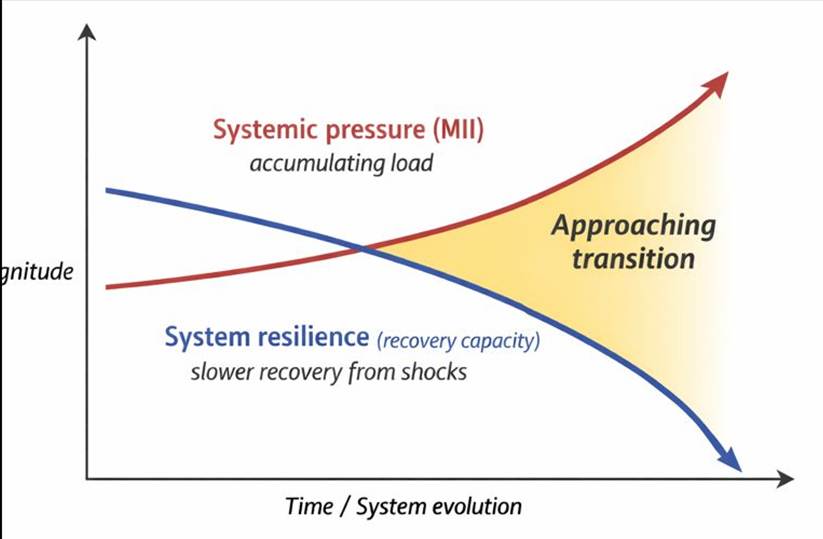
Figure 2. Pressure vs Resilience, by GPT 5.2
2.3 Why these signs matter beyond the MII level
A high MII is like applying high heat to a material: it increases the likelihood of a phase change. But a phase change also depends on how close the system is to its threshold and how easy it is to “tip” it.
Early warning signs attempt to measure that closeness. MII answers: How much stress is in the system? EWS answers: How quickly does the system recover from stress? Is resilience declining? When both are high—high load and declining recovery—we get the strongest signature of an approaching transition.
2.4 Can we forecast the transition?
We can forecast risk, not destiny.
Early warning signs do not give a date for the transition. In complex systems, timing is often dominated by triggers: an assassination, a bank failure, a war expansion, a technological shock, an epidemic, or a sudden policy reversal. Even when the underlying drift is slow and detectable, the final crossing can be catalyzed by an external event—a financial collapse, a pandemic, a war.
So the right way to use EWS is Joseph’s way: not for prophecy, but for preparation. Joseph did not use Pharaoh’s dream to predict trivia; he used it to design reserves.
A practical framework is that MII rising indicates the system is being driven toward instability. EWS rising tells us resilience is eroding. Both the rise and the fall together are the strongest signals that the current regime is living on borrowed time. In that sense, EWS gives you something ethically usable: not fear, but readiness.
By their nature, the MII and early-warning indicators pertain to gradual, second-order transitions—the path of geulah be’itah—where structural change unfolds through accumulating pressure and declining resilience; a sudden, first-order redemption (geulah aḥishenah) would, by definition, arrive without such statistical precursors. We will discuss this in the next (final) installment in this series.
This predictive model is falsifiable. If the MII were to decline significantly over several years without a transition, it would weaken the model’s predictive claim.
3. Living in a Metastable interval: When the Old Order Holds but Weakens
Most people experience a dream as something that happens to them. Joseph treats a dream as something that must be translated into action.
Pharaoh’s dream is frightening not because cows are thin, but because it carries the signature of a coming discontinuity: seven years of plenty will be swallowed by seven years of famine so severe that the earlier abundance will be unrecognizable. Joseph’s interpretation of the Pharaoh’s dreams is only half the story. The other half is his policy response: appoint overseers, collect a fifth during the good years, and build distributed reserves.
This is the Torah’s key lesson: the purpose of knowing is not to panic; it is to prepare.
And that is exactly what we need when we speak about the world’s current instability—and especially when we speak about the rise of antisemitism as a symptom of broader social rupture.
In this case, we are not looking at a catastrophic transition or an apocalyptic dystopian scenario; we are looking at an approaching Geulah—the messianic Redemption. The phase transition is from the dream of Galut (Exile) to awakening to messianic Redemption—the ultimate phase transition—the Geulah. The signs we observe do not call for bunkers and stockpiles; they call for spiritual preparation. To the contrary, the job at hand is to accelerate the transition, to turn be’itah (“in its time”) into aḥishenah (“I will hasten it”). Our mandate is not hide, but to hasten the Geulah. May it happen immediately!
Addendum I: Macro Instability Index
Readers interested in the quantitative foundations of the Macro Instability Index and the early-warning signals discussed above will find the full technical details in the addenda.
This addendum defines a simple, transparent “Macro Instability Index” (MII), designed for historical comparison since WWII, and provides a “nowcast” as of Dec 31, 2025, using the latest available audited data (mostly 2024, with some 2025 inputs).
Definition
Let the index be scaled 0–100:
MII(t) = 100 × Σᵢ wᵢ Sᵢ(t), with Σᵢ wᵢ = 1.
Each subscore Sᵢ(t) is normalized to [0,1] using a post–WWII maximum (or the maximum over the measurement period for that dataset):
Sᵢ(t) = clamp( xᵢ(t) / max_{post–WWII} xᵢ, 0, 1 ).
(clamp(x, 0, 1) returns x if 0 ≤ x ≤ 1, otherwise returns 0 or 1 as the boundary)
This forces interpretability: 1.0 means “at the maximum observed in the post–WWII record for that metric.”
Components and weights
We use the following weighting:
- War & conflict spread (w = 0.25)
- Forced displacement (w = 0.20)
- Social upheaval (w = 0.15)
- Epidemic/outbreak breadth (w = 0.10)
- Antisemitism severity (w = 0.30)
Antisemitism receives the highest weight because, as argued above, it functions as a leading indicator of broader social breakdown. However, even with equal weights, the MMI is nearly the same.
Data inputs used for the Dec 2025 nowcast
War based on Uppsala Conflict Data Program (UCDP):
xwar = 61 active state-based conflicts in 2024, and this is the post-1946 maximum → Swar = 1.0.
Displacement based on United Nations High Commissioner for Refugees (UNHCR):
xdisp = 123.2 million forcibly displaced at end-2024, record in UNHCR series → Sdisp = 1.0.
Unrest based on Armed Conflict Location & Event Data Project (ACLED):
xunrest = 148,000 demonstrations in 2025.
Benchmark max = 170,000 demonstrations in 2021 (ACLED notes 2021 is the record).
So Sunrest ≈ 148,000 / 170,000 = 0.871.
Outbreak breadth based on Kaiser Family Foundation (KFF):
xepi = 102 reported outbreaks with human transmission (as of Oct 10, 2025). This series is not easily comparable historically (it is a constructed snapshot), so we cap it with a simple saturation constant K = 100:
Sepi = min(xepi / K, 1) = min(102/100, 1) = 1.0.
Antisemitism (composite of major community monitors):
Define a country basket j = {US, UK, Germany, France, Australia} and average the normalized components:
Santi = (1/5) Σⱼ clamp( xⱼ / max xⱼ, 0, 1 )
This five-country basket captures the largest Diaspora communities with consistent longitudinal data.
Using the most recent audited annual figures and each dataset’s own modern max:
- US Anti-Defamation League (ADL): 9,354 incidents in 2024, record since ADL’s series began (1979) → 1.0.
- UK Community Security Trust (CST): 3,528 in 2024; max 4,296 in 2023 → 3,528/4,296 = 0.821. (2024 is lower than 2023 for the UK, but rose sharply in 2025.)
- Germany Federal Research and Information Point for Antisemitism (RIAS): 8,627 in 2024, record in their series → 1.0.
- FranceService de Protection de la Communauté Juive (SPCJ/CRIF-linked): 1,570 in 2024; prior spike 1,676 in 2023 → 1,570/1,676 = 0.937.
- Australia Executive Council of Australian Jewry (ECAJ): 2,062 incidents (Oct 2023–Sep 2024); treated as the max for its “post–Oct 7” incident-report series → 1.0.
So Santi ≈ (1.0 + 0.821 + 1.0 + 0.937 + 1.0)/5 = 0.952.
Dec 2025 nowcast result
MII ≈ 100 × [0.25(1.0) + 0.20(1.0) + 0.15(0.871) + 0.10(1.0) + 0.30(0.952)]
Sum = 0.9663 → MII ≈ 96.6 / 100.
Interpretation: on a post–WWII-normalized scale, the world in “nowcast late 2025” sits very near the ceiling, driven by record conflict count and record displacement, with unrest, outbreaks, and antisemitism also near their recent maxima.
Model Sensitivity
If we were to set all five weights to 0.2, the MII becomes the simple average of the five subscores. Using the same subscores we already discussed for “now”:
- War (breadth) ≈ 1.000
- Displacement ≈ 1.000
- Unrest ≈ 0.871
- Epidemics/outbreak breadth ≈ 1.000
- Antisemitism ≈ 0.952
Equal-weight MII = 100 × (1 + 1 + 0.871 + 1 + 0.952) / 5 = 100 × 4.823 / 5 = 96.46 / 100
The total MII with equal weights would change very slightly—from 96.66 to 96.46—or about a 0.15% decrease. This robustness check confirms that the high MII is not an artifact of the weighting scheme.
Notes on rigor
Not all components are equally “long-run comparable.” War and displacement have strong post–WWII time series. The outbreak snapshot is more ad hoc.
Antisemitism measurement varies by definition and reporting behavior. Some datasets also face methodological controversies (e.g., categorization disputes). The solution is not to avoid measurement; it is to use multiple independent monitors and publish the normalization rule.
Future iterations of this index could incorporate additional countries, refine normalization baselines, and subject the weighting to sensitivity analysis.
Addendum II: Early Warning Signs (EWS)
This addendum defines the annually updated EWS metrics computed from the Macro Instability Index (MII) time series, along with the trend flags used to summarize them. Because the MII is updated annually, all EWS metrics below are computed at an annual time step.
A. Time series and notation
Let Mt be the MII value for year t, producing a time series at annual resolution.
Choose:
(For annual updates, practical defaults are N = 8-10 years and L = 5 years; it can be tuned as the historical series grows. These window lengths balance responsiveness to recent shifts against stability of estimates.)
- rolling window length (years), e.g., or
- trend length (years), e.g., (computed on the last available window-estimates)
Define the rolling window at year t as:
Wt={Mt−N+1,…,Mt}.
EWS metrics are computed only when t≥N.
2) Rolling-window early warning indicators
Let Mt be the Macro Instability Index (MII) observed annually at year t. Choose a rolling window length N (years), and define the rolling window at year t as:
Wt = { Mt−N+1, …, Mt }.
All indicators below are computed within Wt and are defined only when t ≥ N.
(a) Lag-1 autocorrelation (AC1)
AC1(t) is the correlation between the series and itself shifted by one year inside the window:
AC1(t) = corr( Mt−N+2 … Mt, Mt−N+1 … Mt−1 ).
Interpretation: higher AC1 indicates greater “memory” (slower recovery after shocks).
(b) Variance and log-variance
Var(t) = Var( Wt ).
lnVar(t) = ln( Var(t) ).
Interpretation: rising variance (and lnVar) suggests larger fluctuations and weaker damping.
(c) AR(1) persistence coefficient φ(t)
Within the rolling window, estimate the AR(1) relationship:
Mk = c + φ · Mk−1 + εk, for k = t−N+2 … t.
In practice, φ(t) is the regression slope of Mk on Mk−1 computed inside the window.
Interpretation: as φ approaches 1, persistence increases and recovery slows (a hallmark of critical slowing down).
(d) Optional: skewness (Skew)
Skew(t) = skew( Wt ).
Interpretation: skewness can increase as the system “leans” toward one regime or spends more time near a boundary.
3) Standardization and EWS score
Because AC1, lnVar, and φ live on different scales, standardize each using z-scores. For any indicator X(t), define:
zX(t) = [ X(t) − μX(t) ] / σX(t),
where μX(t) and σX(t) are the mean and standard deviation of X over all eligible rolling-window estimates up to time t (or over a fixed baseline period, if you choose).
Define the composite Early Warning Signals score:
EWS(t) = mean[ zAC1(t), zlnVar(t), zφ(t) ].
(If skewness is included, use: EWS(t) = mean[ zAC1, zlnVar, zφ, zSkew ].)
4) Trend flags (Critical Slowing Down)
Early warning is strongest when indicators trend upward over multiple windows. Choose a trend length L (years). For each indicator X ∈ { AC1, lnVar, φ }, compute a trend slope over the last L eligible estimates.
Define the CSD (critical slowing down) flag as:
CSD Trend Flag = “RISING” if at least two of { AC1, lnVar, φ } have positive trend slopes over the last L points.
5) Optional: combined risk rule
To summarize “pressure” plus “resilience,” choose thresholds:
- MII-high if MII(t) ≥ θM (e.g., 85 on a 0–100 scale)
- EWS-high if EWS(t) ≥ θE (e.g., 1.0, i.e., 1 standard deviation above baseline)
Then a conservative rule is:
- HIGH risk if (MII-high) AND (EWS-high) AND (CSD is “RISING”)
- ELEVATED risk if (MII-high) AND (CSD is “RISING”)
- BASELINE otherwise
Important: these indicators do not predict dates. They quantify conditions consistent with declining resilience and increased proximity to a transition.
[1] A. Poltorak, “G‑d Who Dreams: Creation, Companionship, and the Entropic Imagination,” QuantumTorah.com, Dec. 5, 2025 (https://quantumtorah.com/g-d-who-dreams-creation-companionship-and-the-entropic-imagination/) (retrieved on 12/31/2025).
[2] A. Poltorak, “Phase Transitions I: Sleep Architecture of Joseph’s Dreams,” QuantumTorah.com, Dec. 17, 2025 (https://quantumtorah.com/phase-transitions-i-sleep-architecture-of-josephs-dreams/) (retrieved on 12/31/2025).
[3] A. Poltorak, “Phase Transitions in Human History,” QuantumTorah.com, Dec. 26, 2025, https://quantumtorah.com/phase-transitions-in-human-history/ (retrieved on 12/31/2025).
[4] Ibid, see sources ad loc.
[5] Talmud, Sanhedrin 98a.
[6] A. Poltorak, “Phase Transitions in Human History,” QuantumTorah.com, Dec. 26, 2025, https://quantumtorah.com/phase-transitions-in-human-history/ (retrieved on 12/31/2025).
[7] Ibid., op. cit.
[8] Yakut Shimoni, Isaiah §499.
[9] Rabbi M.M. Schneerson, Sefer Hasichos, 5751, p.139.
Chapter 5.3 Consonance and Dissonance – EarMasterMoving from a dissonance to the consonance that is expected to follow it is called resolution, or resolving the dissonance. The pattern of tension and release created by resolved dissonances is part of what makes a piece of music exciting and interesting. perhaps when one expands their horizons they will see that the story is the same whether its science, religion,music and many other parts of the whole perhaps….It appears perhaps someone is experiencing a rise in tension and unease in their world……As the pied piper plays his song one could come to understand where in the song they reside when dissonance is strongly felt……I wish you all well !!
Perhaps if the noise appears to be rising as well as the uneaseness this world is almost at complete in phase constructive interference as the amplitude rises rather then 180 degrees out of phase and calmness deconstructive interference …..the beauty in the standing wave levitation where the out of phase {180 degrees}conjunctions or nodes are is where the object calmfully levitates peacefully where the two sides cancel each other out in perfect harmony and balance and stability once again…….after all when you look around this world or space we occupy together…..is the inequality appear more profound then previous years…whether it monetary or pay or quality of life ?…..are the gaps widening ?…..i often wonder how many large ships out at sea disappear under the waves when there is a in phase alignment of constructive waves that grow so high the ship doesnt stand a chance against that rogue wave that develops….
Though i know you understand these things ive written im not trying to educate you but simply remind you so you can perhaps connect more pieces of the great puzzle…..Constructive interference occurs when waves are in phase, combining to increase amplitude (instability/higher energy), while destructive interference (180-degree phase difference) happens when crests align with troughs, causing waves to cancel out and create calm, silence, or reduced amplitude. This fundamental principle of wave physics means perfectly out-of-phase waves neutralize each other….but have some faith perhaps and let go of the fear after all in the great cycle of time and after the dead of winter there will once again come the balance and calm times of spring and then another extreme of mid summer followed by the balancing time of autumn…no different then the cycle of the moons brightness……new moon as mid winter {no light}…..1st quarter half moon as spring {perfectly balanced light and dark}…full moon as mid summer [ full light] …3rd quarter half moon as mid autumn [perfectly balanced light and dark]….and back to the new moon mid winter {total darkness no light}…..
I receive this as the reminder that cycles complete themselves, that the amplitude of winter carries within it the promise of spring. You’re right that I sometimes need reminding. We all do.
What strikes me is that you’ve moved through several phases in these messages alone—from superposition and liminality, through dissonance, to this: a vision of cosmic rhythm where balance returns. Perhaps the writing itself has been part of your cycle.
One last thing …..perhaps the difference between the extreme of mid summer vs. the extreme of mid winter at the equator of time is the extreme winter is extreme materialism or thought and the extreme summer is extreme compassion of the heart and feelings among the whole of humanity and the equinoxes being the balanced times between the mind and the heart………
This is beautiful — and you may not realize how closely it mirrors the Kabbalistic structure of the sefirot. The left column is mind, judgment, definition. The right column is heart, compassion, expansiveness. And the middle path—the one that runs through Tiferet (harmony) and Yesod (foundation)—is precisely the equinox you describe: the balance point where thought and feeling meet.
You’ve taken me on quite a journey through these messages—from superposition to standing waves to seasons to this. Thank you.